Most people who start running stop within weeks. Running apps are built to measure runs — not to keep a person running. RunX is designed around the one moment every competitor gets wrong: what happens when you miss a week.
- 27
- Survey responses
- 6
- Interviews
- 6
- Apps benchmarked
- 6
- Weeks
Research and design
Hazel Khosravi
Ran the user research and the competitive analysis, built the personas, the journey map and the information architecture, drew the user flows and the wireframes, and designed the UI and the hi-fi prototype.
Six weeks, from a blank page to a hi-fi prototype. Tools: Figma, FigJam, Miro and Google Forms.
RunX is published for the research and the reasoning rather than for a commercial result.
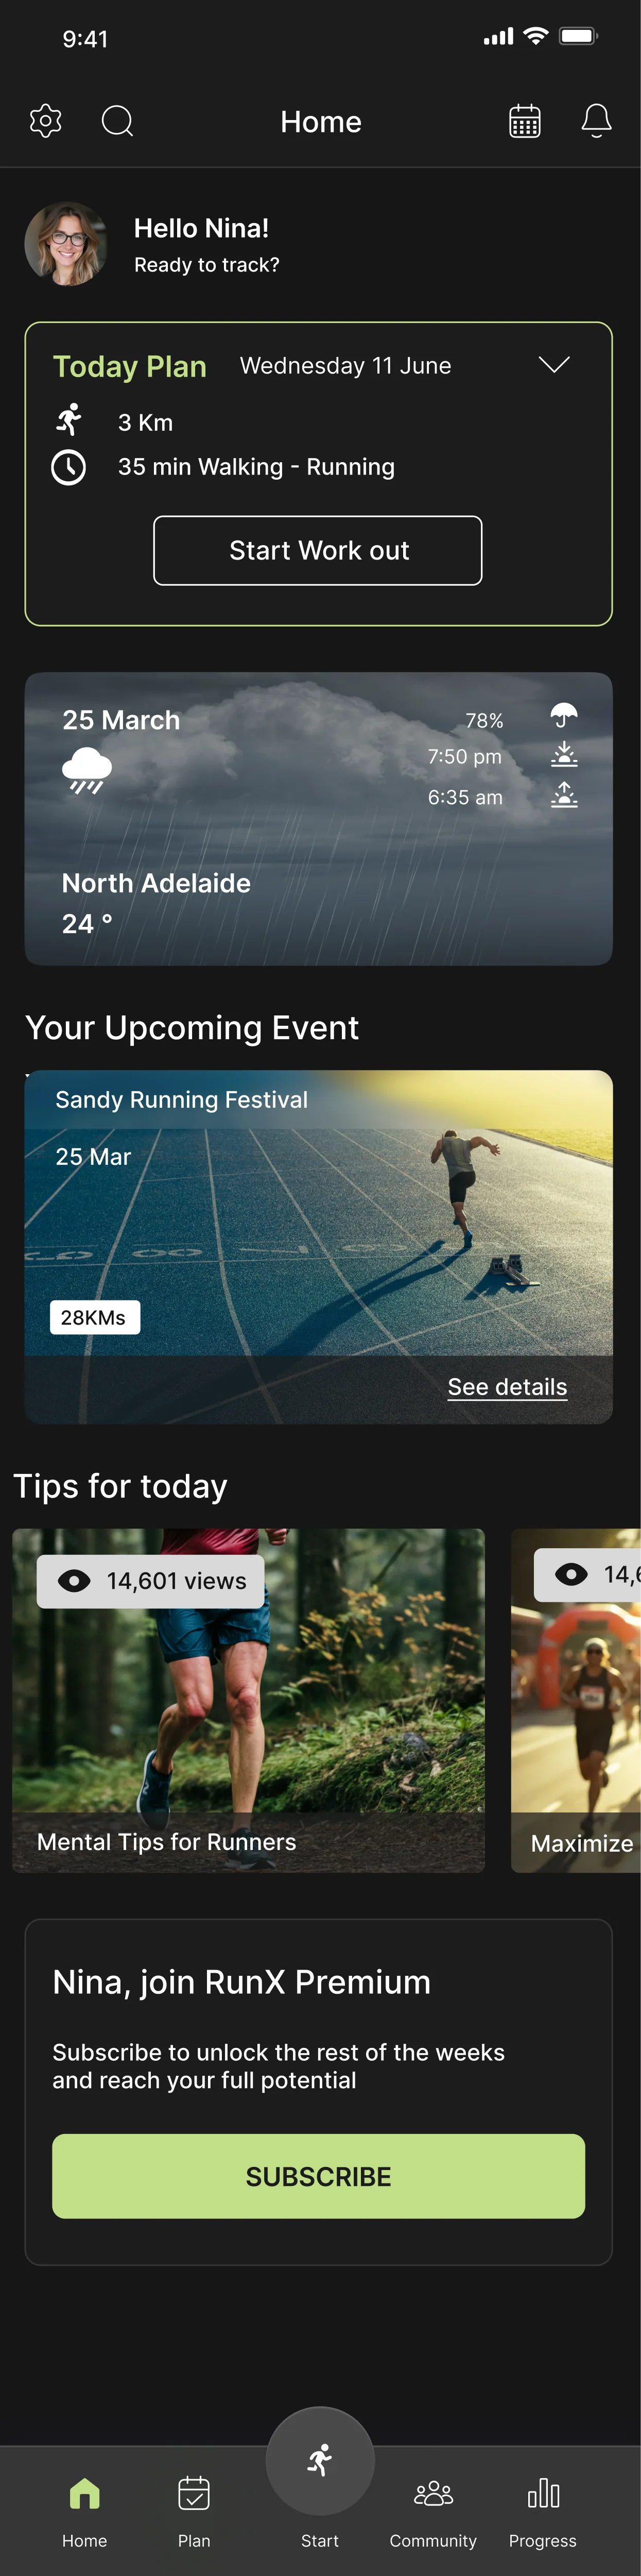
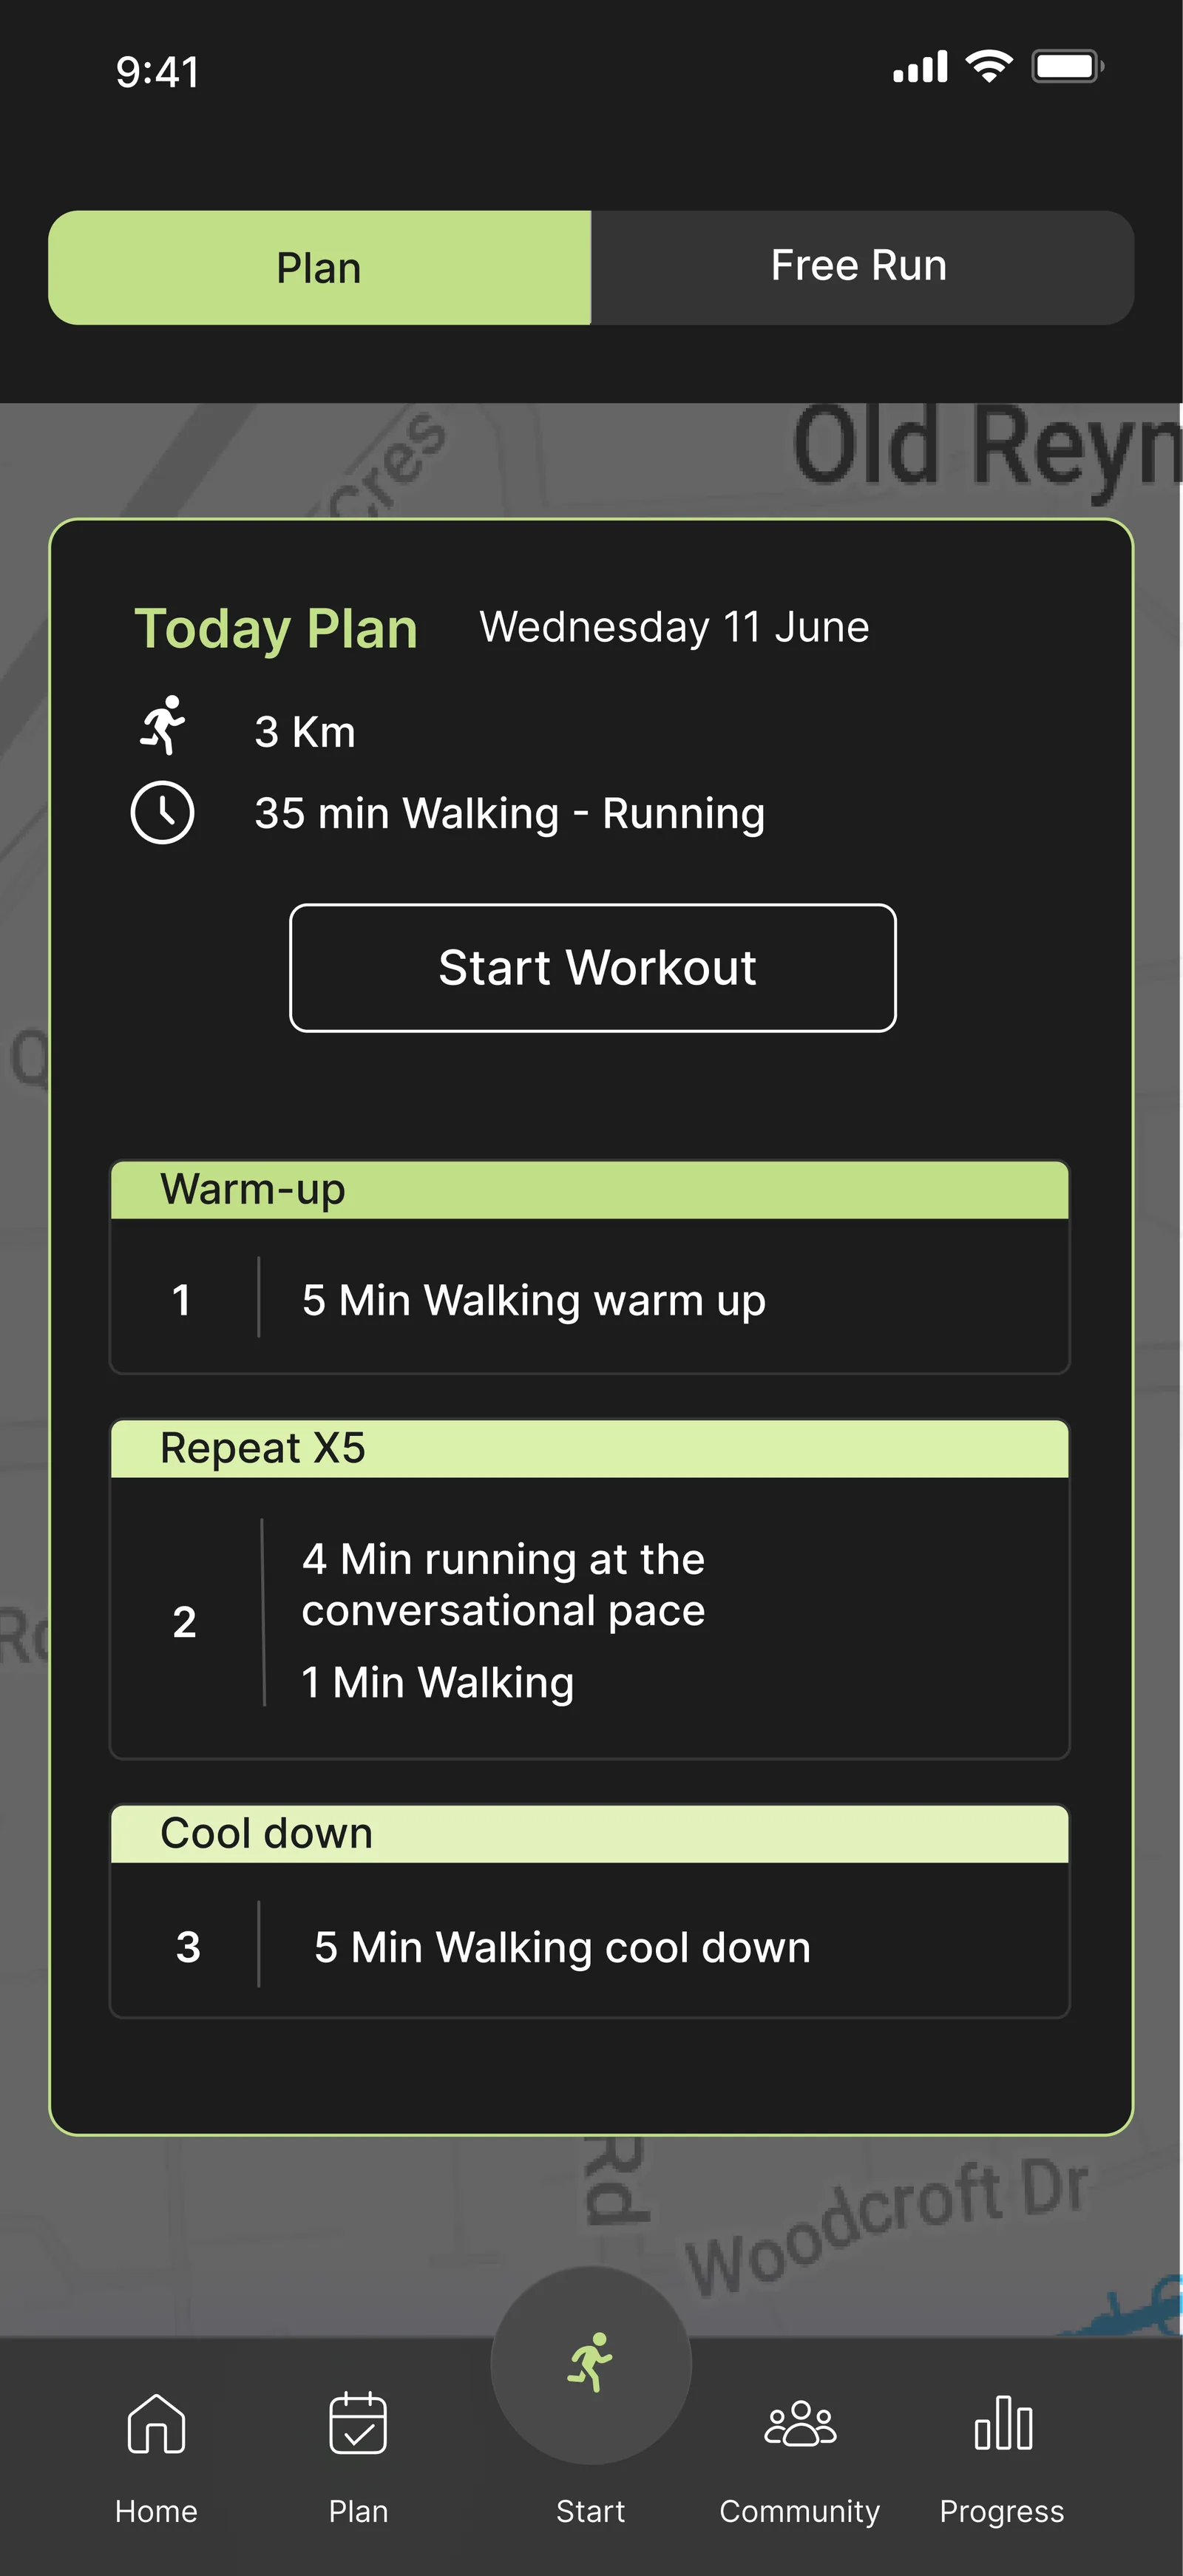
Running is the cheapest way into fitness, and it has the highest drop-off
57%
of non-runners say the barrier is motivation, not fitness (n=23)
80%
say beginners need a clear step-by-step plan (n=25)
~50%
name subscription cost as their biggest complaint (n=25)
3 of 6
interviewees had abandoned an app that reset their plan (interviews)
It forced me to restart from week one, which made me feel behind and back to zero.
Mahtab, semi-professional runner, on why she deleted the app
Beginner and intermediate runners want a plan they can stick to. The apps available optimise for tracking performance rather than sustaining motivation — they overwhelm newcomers with data, hide personalisation behind a subscription, and penalise anyone whose life gets in the way.
Four principles, and everything after them is traceable to one
- Guided, not overwhelming
- One clear action per screen. Depth is one tap away.
- Forgiving, not punishing
- A missed week adjusts the plan. It never resets it.
- Personal, not generic
- Core personalisation is free, not a premium tier.
- Belonging, not ranking
- Group runs and shared routes. No global leaderboard.
What the research actually asked
- Online survey, 13 questions
- 27 respondents, 20–26 per question — to quantify behaviour, goals and feature priorities
- Semi-structured interviews, 30–40 min
- 6 participants across Iran and Australia — one beginner, one professional, four semi-professional — for depth on motivation, friction and emotional drivers
- Competitive analysis
- 6 apps — a feature benchmark and the market gap
Limitations, stated up front
n=27 is directional, not statistically significant. The sample skews 25–44 and digitally confident, under-representing runners over 55. Recruitment was convenience sampling through personal and running-community networks, which introduces network bias.
- Why people don't run(n=23, multi-select)
- No motivation 57% · a preference for other workouts 39% · not knowing where to start 22%
- Why people do run(n=25)
- Staying fit or losing weight 72% · mental health and stress relief 52% · improving speed and endurance 24%
- What beginners need(n=25)
- A clear step-by-step plan 80% · motivational reminders 56% · warm-up and recovery guidance 44%
More than half of runners run for their head, not their legs — and not one competitor in the benchmark supports mental wellbeing in any form.
The finding this product was built on
Community scored lowest of every feature in the survey — 8%. It came up in all six interviews.
Taken separately, one of those is noise. Taken together they say the same thing: people do not want to be ranked, they want company. The qualitative data explained what the quantitative data could not.
So group runs, shared routes and self-defined streaks ship in v1. No global leaderboard ships at all — a feature ranked last by the survey became one of the defining decisions of the product.
A leaderboard is unhealthy for running, especially for beginners — it can make them feel discouraged.
Mahtab
Following the higher number would have produced a worse app.
From clusters to decisions
Affinity mapping sorted more than ninety observations into six clusters. Each resolved into one insight with one design consequence, and every feature later in the project traces back to one of them.
- The barrier is starting and continuing, not running
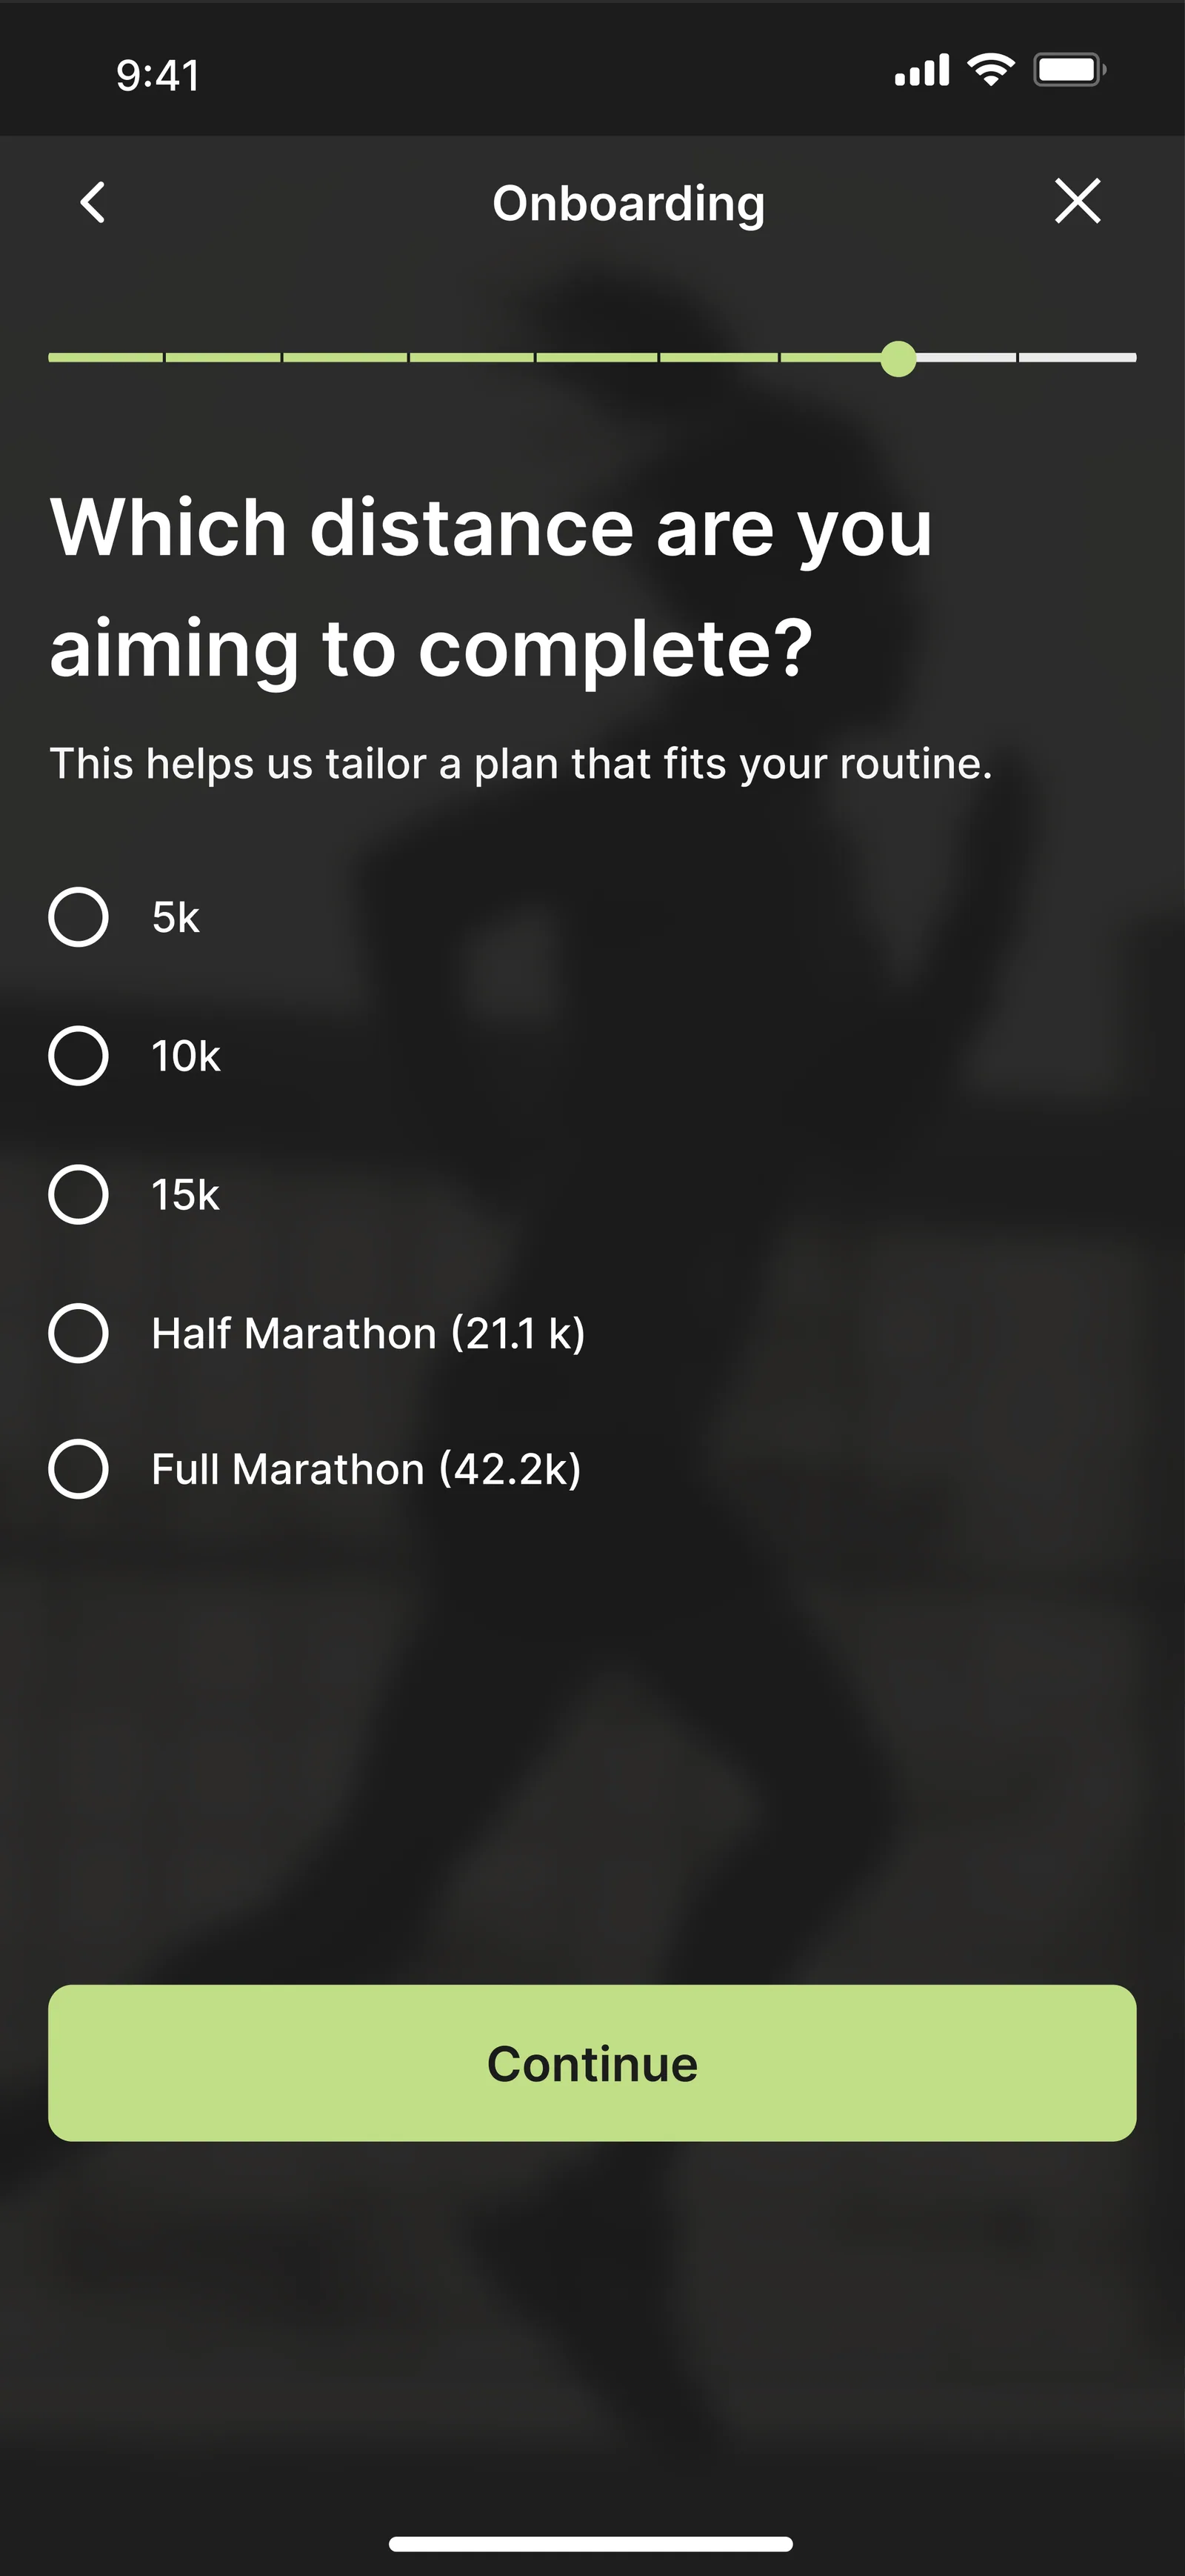
- Onboarding is the product: goal → level → plan in under two minutes
- Plans must forgive absence
- Missed days trigger a lighter bridge week, never a reset
- People pay for personalisation, not more data
- Core personalisation free; premium means depth, not access
- Two segments, one product
- Simple default view, advanced stats one tap deeper
- Community yes, competition no
- Group runs, shared routes, self-defined streaks
- Running fits around life, not the reverse
- Weather-aware scheduling, flexible days, 20-minute plans
The gap in the market
Six apps were benchmarked in March 2026 — Runna, Nike Run Club, Adidas Running, Strava, Runkeeper, and Couch to 5K.
Every competitor either coaches beginners through a fixed programme and then abandons them, or tracks performance for people who already know how to train.
None adapts the plan to a life that changes. None acknowledges that half of the respondents run for their mental health. Those two columns are empty across the entire benchmark, and they are the whole strategic argument.
Where RunX sits: guided and adaptive coaching, for beginners and the people they become. An empty quadrant.
Who it is for
Sara Ahmadi
28 · Marketing Coordinator · Melbourne — the beginner
I want to start running, but I don't know what “easy pace” means and I'm scared of looking like I don't belong.
Walks daily, has never followed a training plan, has never used a fitness app, phone only. Wants a habit she can keep and a 5K without stopping within three months. Blocked by too much information at once, apps that assume prior knowledge, and immediate paywalls.
- motivated
- confused
- self-conscious
- guilty
- gives up
Her emotional sequence is the product brief in five words. Every RunX decision interrupts that sequence at a different point.
Olivia Lee
35 · Accountant · Melbourne — the intermediate
Methodical, time-poor, runs to manage the stress of a demanding job. Wants to shave minutes off her 5K, track long-term progress, and sync with the tools she already uses. Her frustration trigger is a hard week at work — she needs the plan to shrink, not break.
Two personas, two design modes. Sara justifies progressive disclosure, plain language and the free tier. Olivia justifies wearable sync, analytics depth and flexible scheduling.
Where every competitor loses her
The journey map, seven stages, pain on the left and the opportunity it opens on the right.
- 1 · Trigger
- No entry point → a mood-led way in
- 2 · Choosing
- Paywall before value → free core plan, no card required
- 3 · Onboarding
- Long forms, jargon → five questions, plain language
- 4 · First two weeks
- Data overload → a simple default view
- 5 · Busy week — the lowest point
- The plan breaks → a proactive “life happens” message
- 6 · Return
- Reset to week one, then churn → a bridge week and user-defined streak rules
- 7 · Long term
- Progress buried in numbers → a weekly digest and PB highlights
Stages 5 and 6 are where every competitor loses the user, and where RunX wins them. The entire solution is built out of that opportunity column.
The flow that is the product
Flow C — missed sessions
- Open the app after five or more days
- The system detects two or more missed sessions
- “Life happens. Let's pick this back up.”
- Four options: repeat last week · lighter week · continue as planned · rebuild my plan
- The plan recalculates
- “Your streak rule is two runs a week — you're still on track”
- Today's workout
A constraint worth stating
No screen in this flow uses the words failed, behind or restart. The copy rule is itself a design decision.
Structure, and the decisions behind the surface
Six top-level areas — Home, Plan, Run, Progress, Community, Settings — mapped to the two segments. Sara lives in Plan and Run; Olivia lives in Progress and Settings. The website has one job: convert interest into a personalised plan and hand off to the app.
Structure that came straight from participants
- Night mode
- Interviewees run at 5am and in low light
- Emergency alert and live location
- Safety, raised repeatedly and unprompted
- Weather
- The right conditions are what keep Mahtab consistent
- Audio guide and glossary
- Training jargon is a barrier, not a detail
- Units of measure
- A mixed Iran and Australia sample: km and miles both required
- Shoes
- Mileage per pair — requested by the two highest-mileage participants

Lime over red
Sports brands default to red and orange — the colours of intensity and warning. RunX uses a bright lime instead: energetic but encouraging, closer to growth than to alarm, and visually separate from Strava's orange and Nike's black and red. Teal carries the data, a calm counterweight for charts and Olivia's half of the product.
Casting is a design decision
The photography casts ordinary runners, not athletes mid-sprint, because Sara said she was scared of looking like she didn't belong. The fear the persona is built from is the fear the art direction had to answer.
Accessibility, set as rules rather than checked at the end
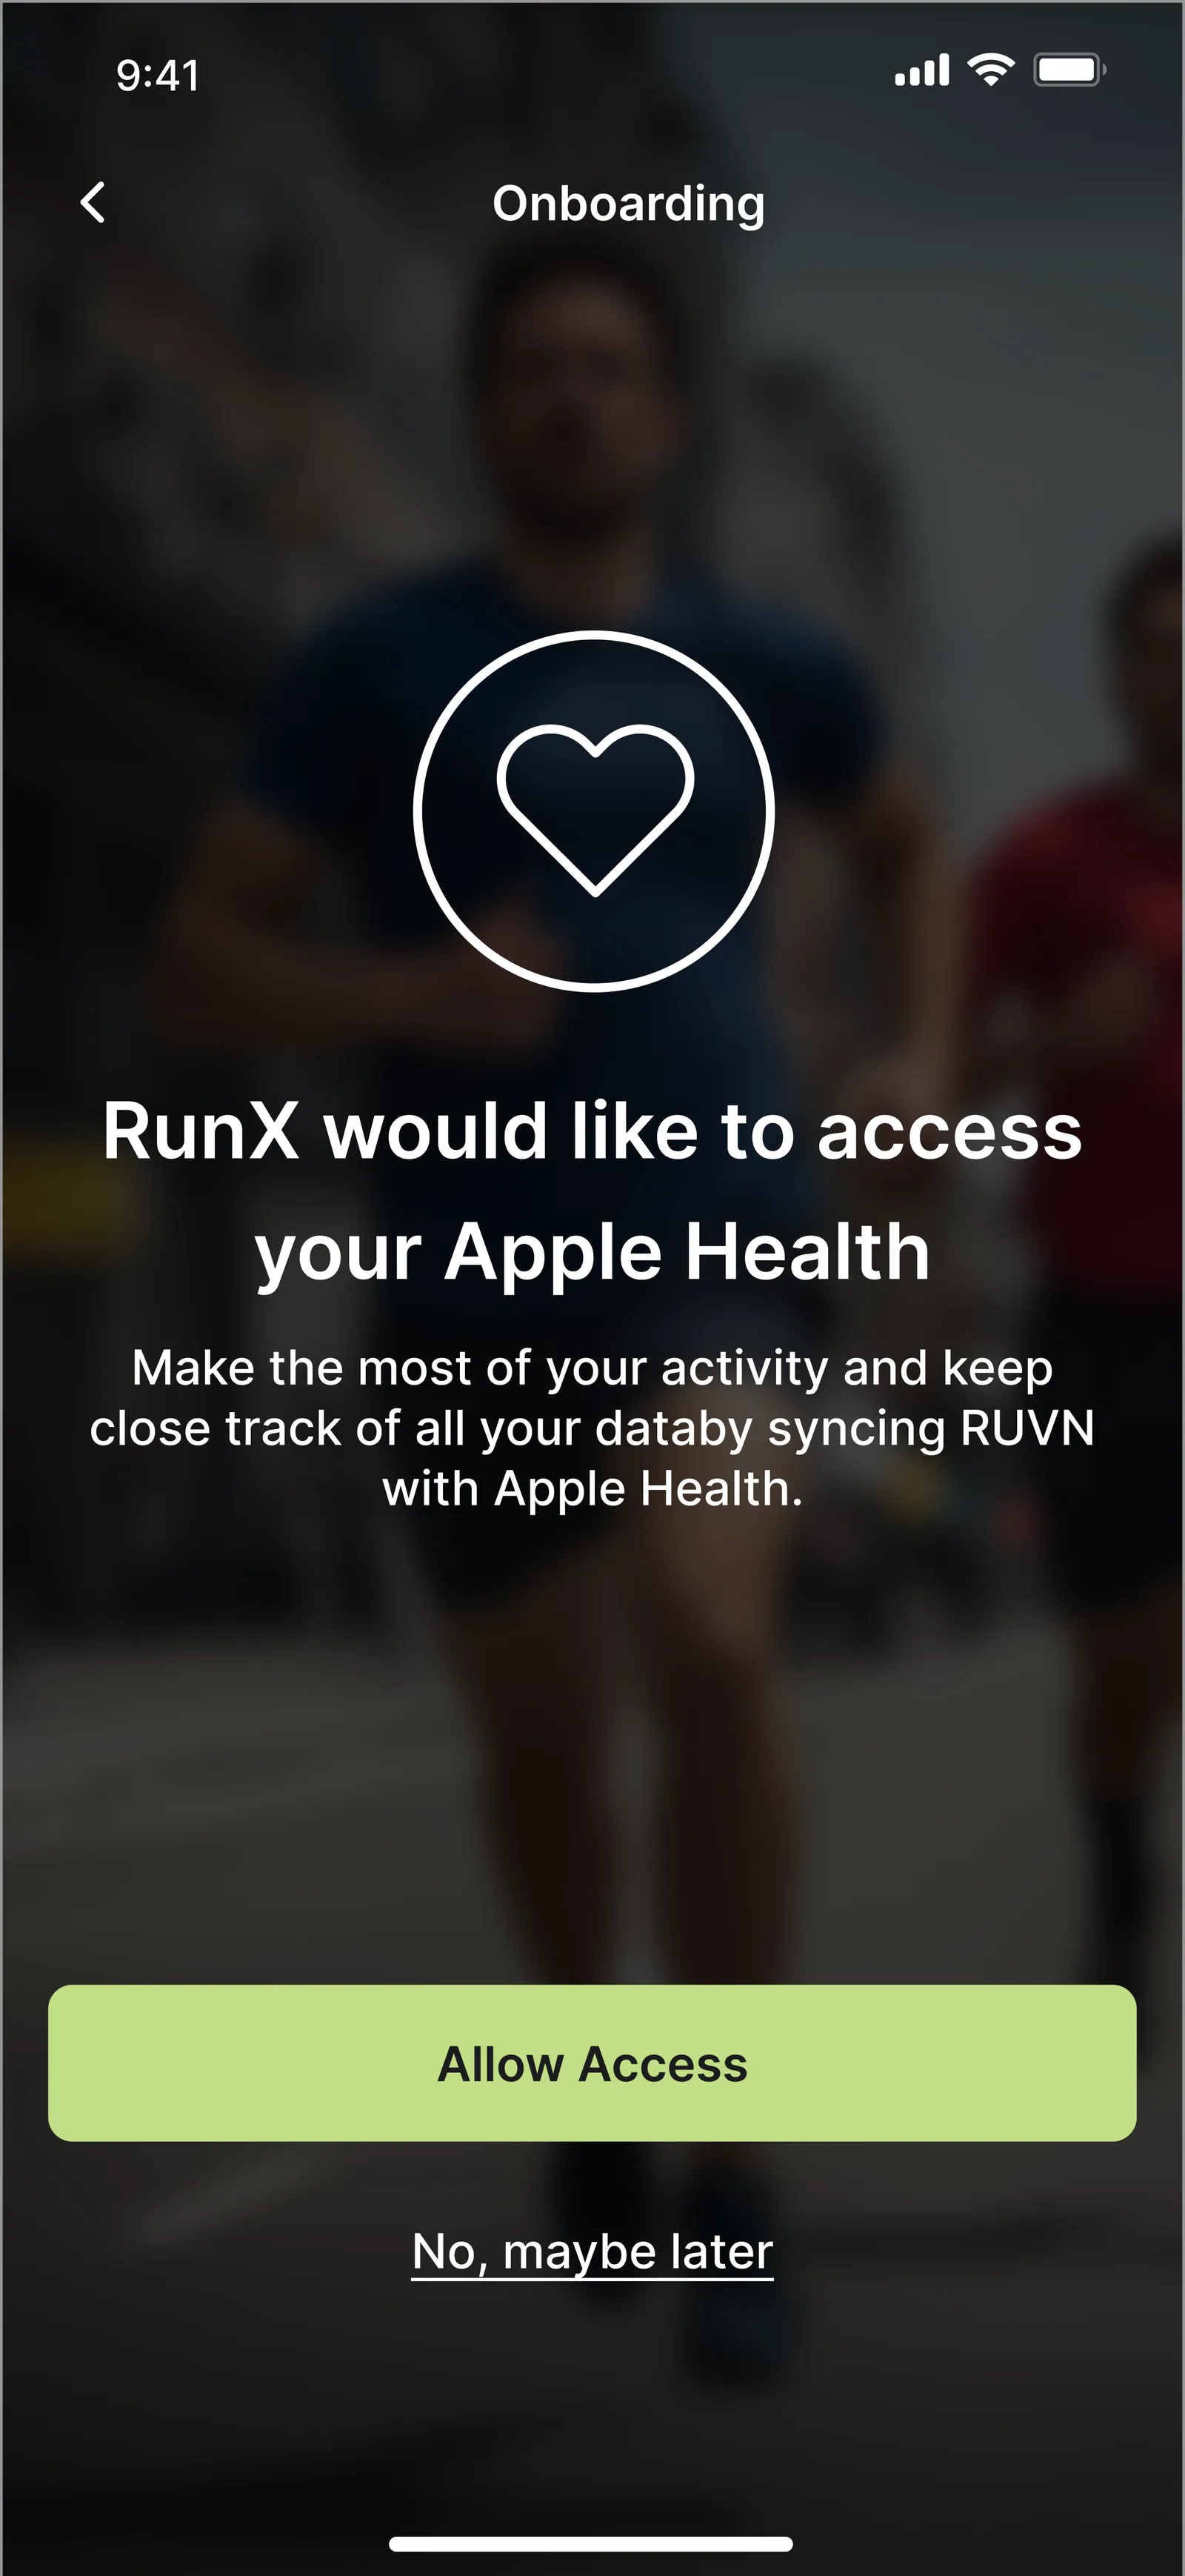
Lime on white fails WCAG AA for text, so lime is used as a fill with ink on top and never as a text colour on a light surface. Minimum touch targets of 44×44pt — people tap start and pause while moving, cold, in the dark. Primary run controls sit in the lower third for one-handed reach. Dynamic Type to 200%, and VoiceOver labels on every metric tile.
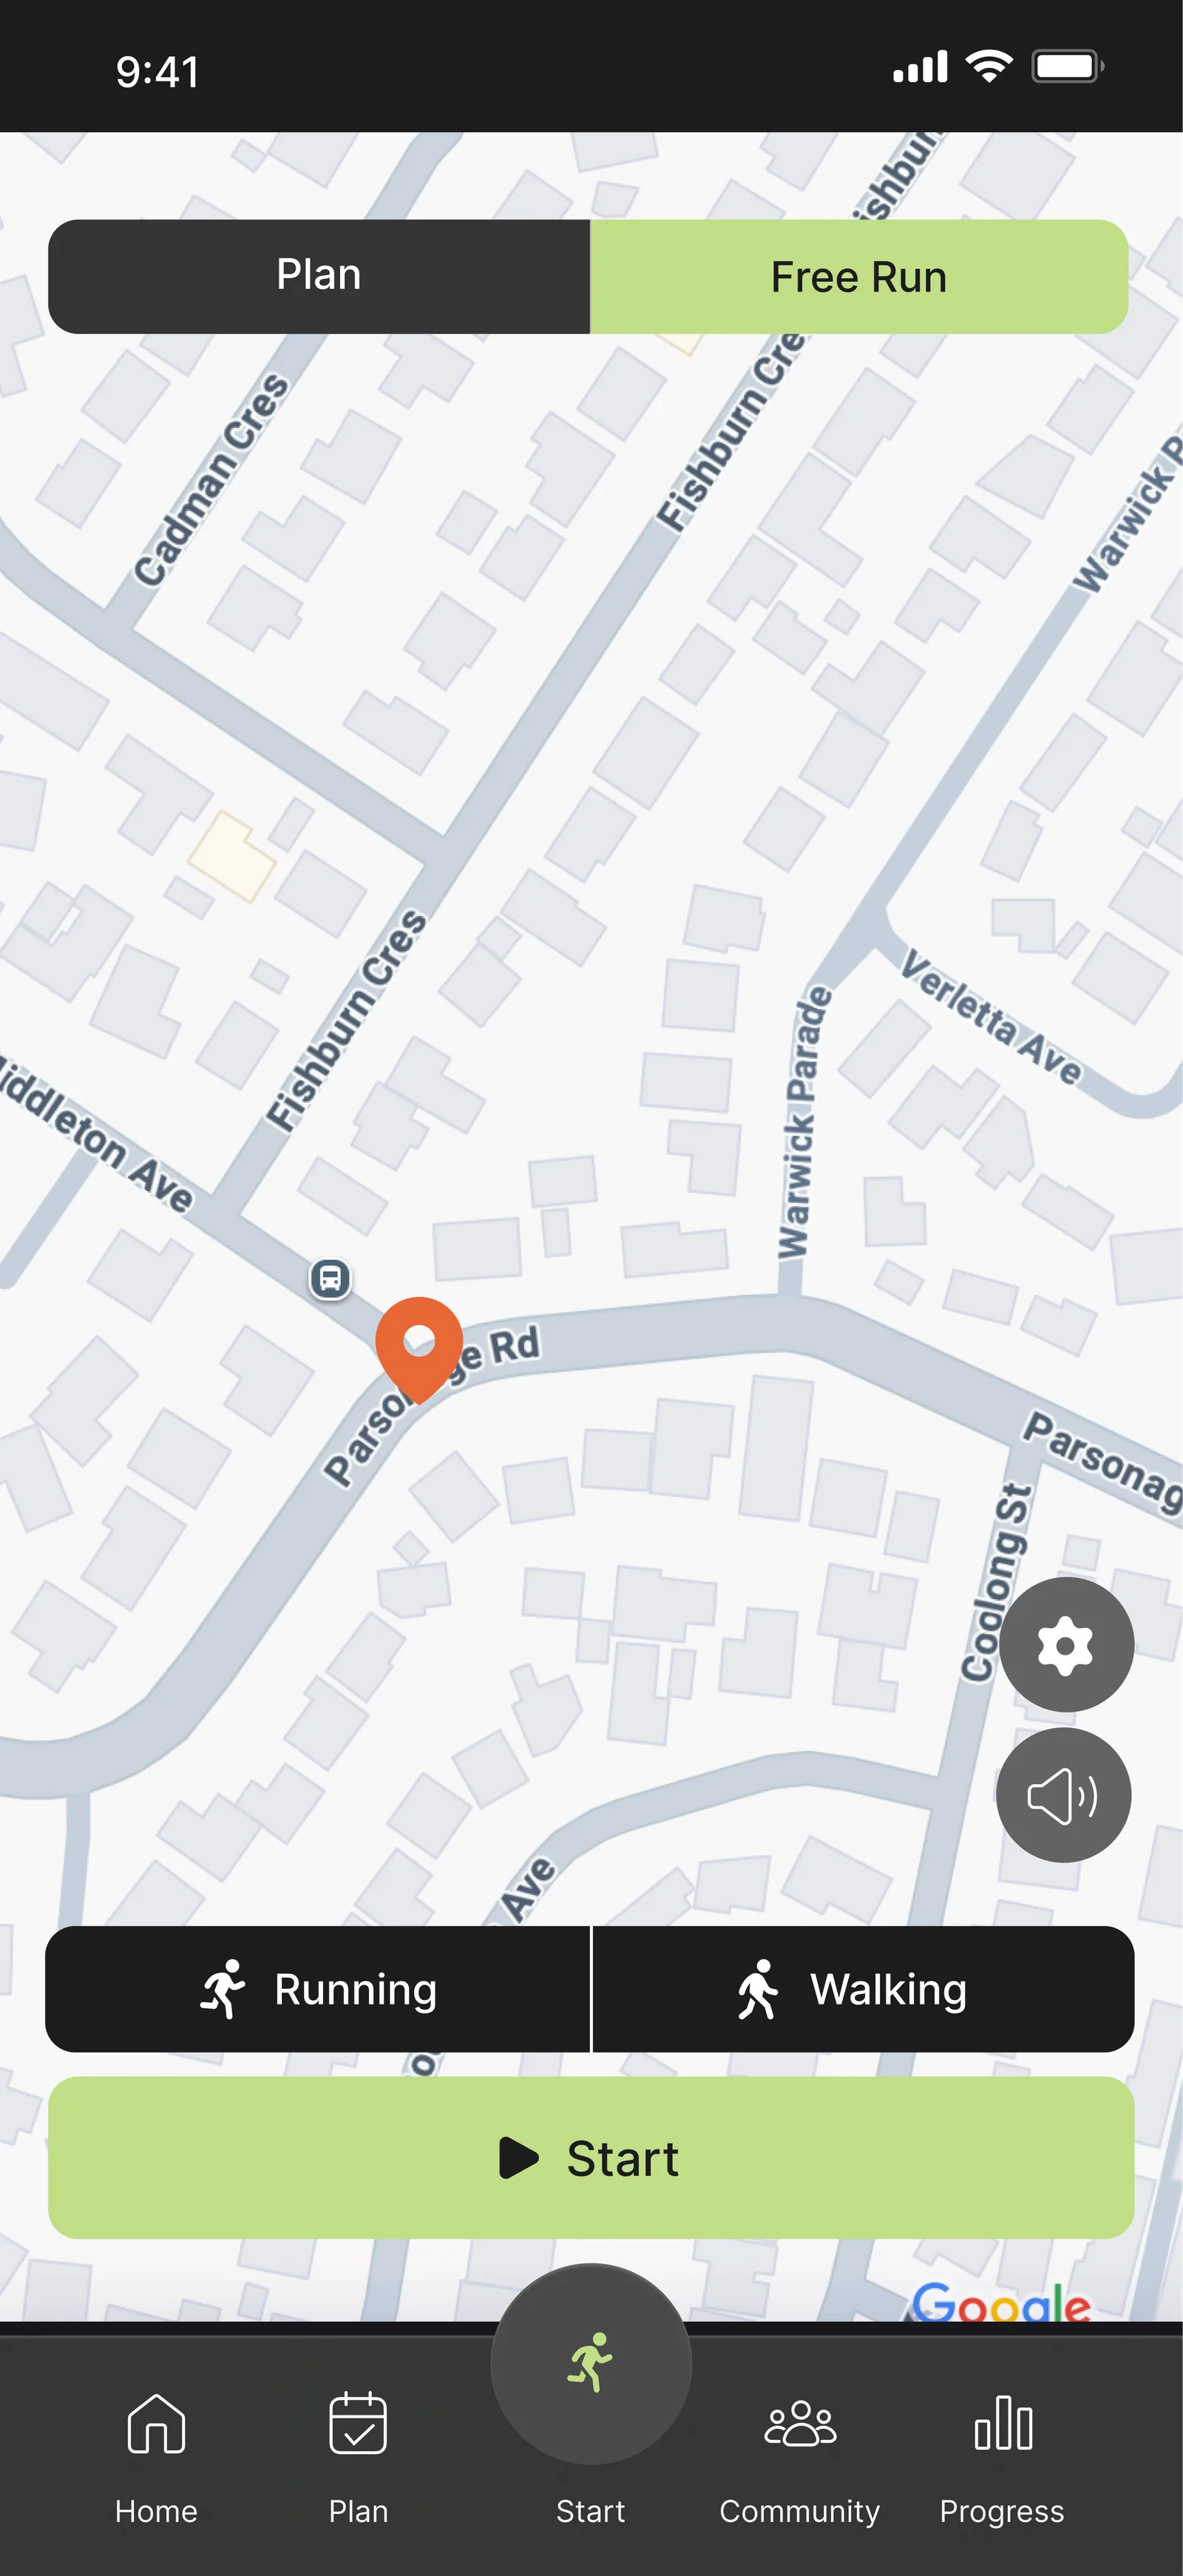
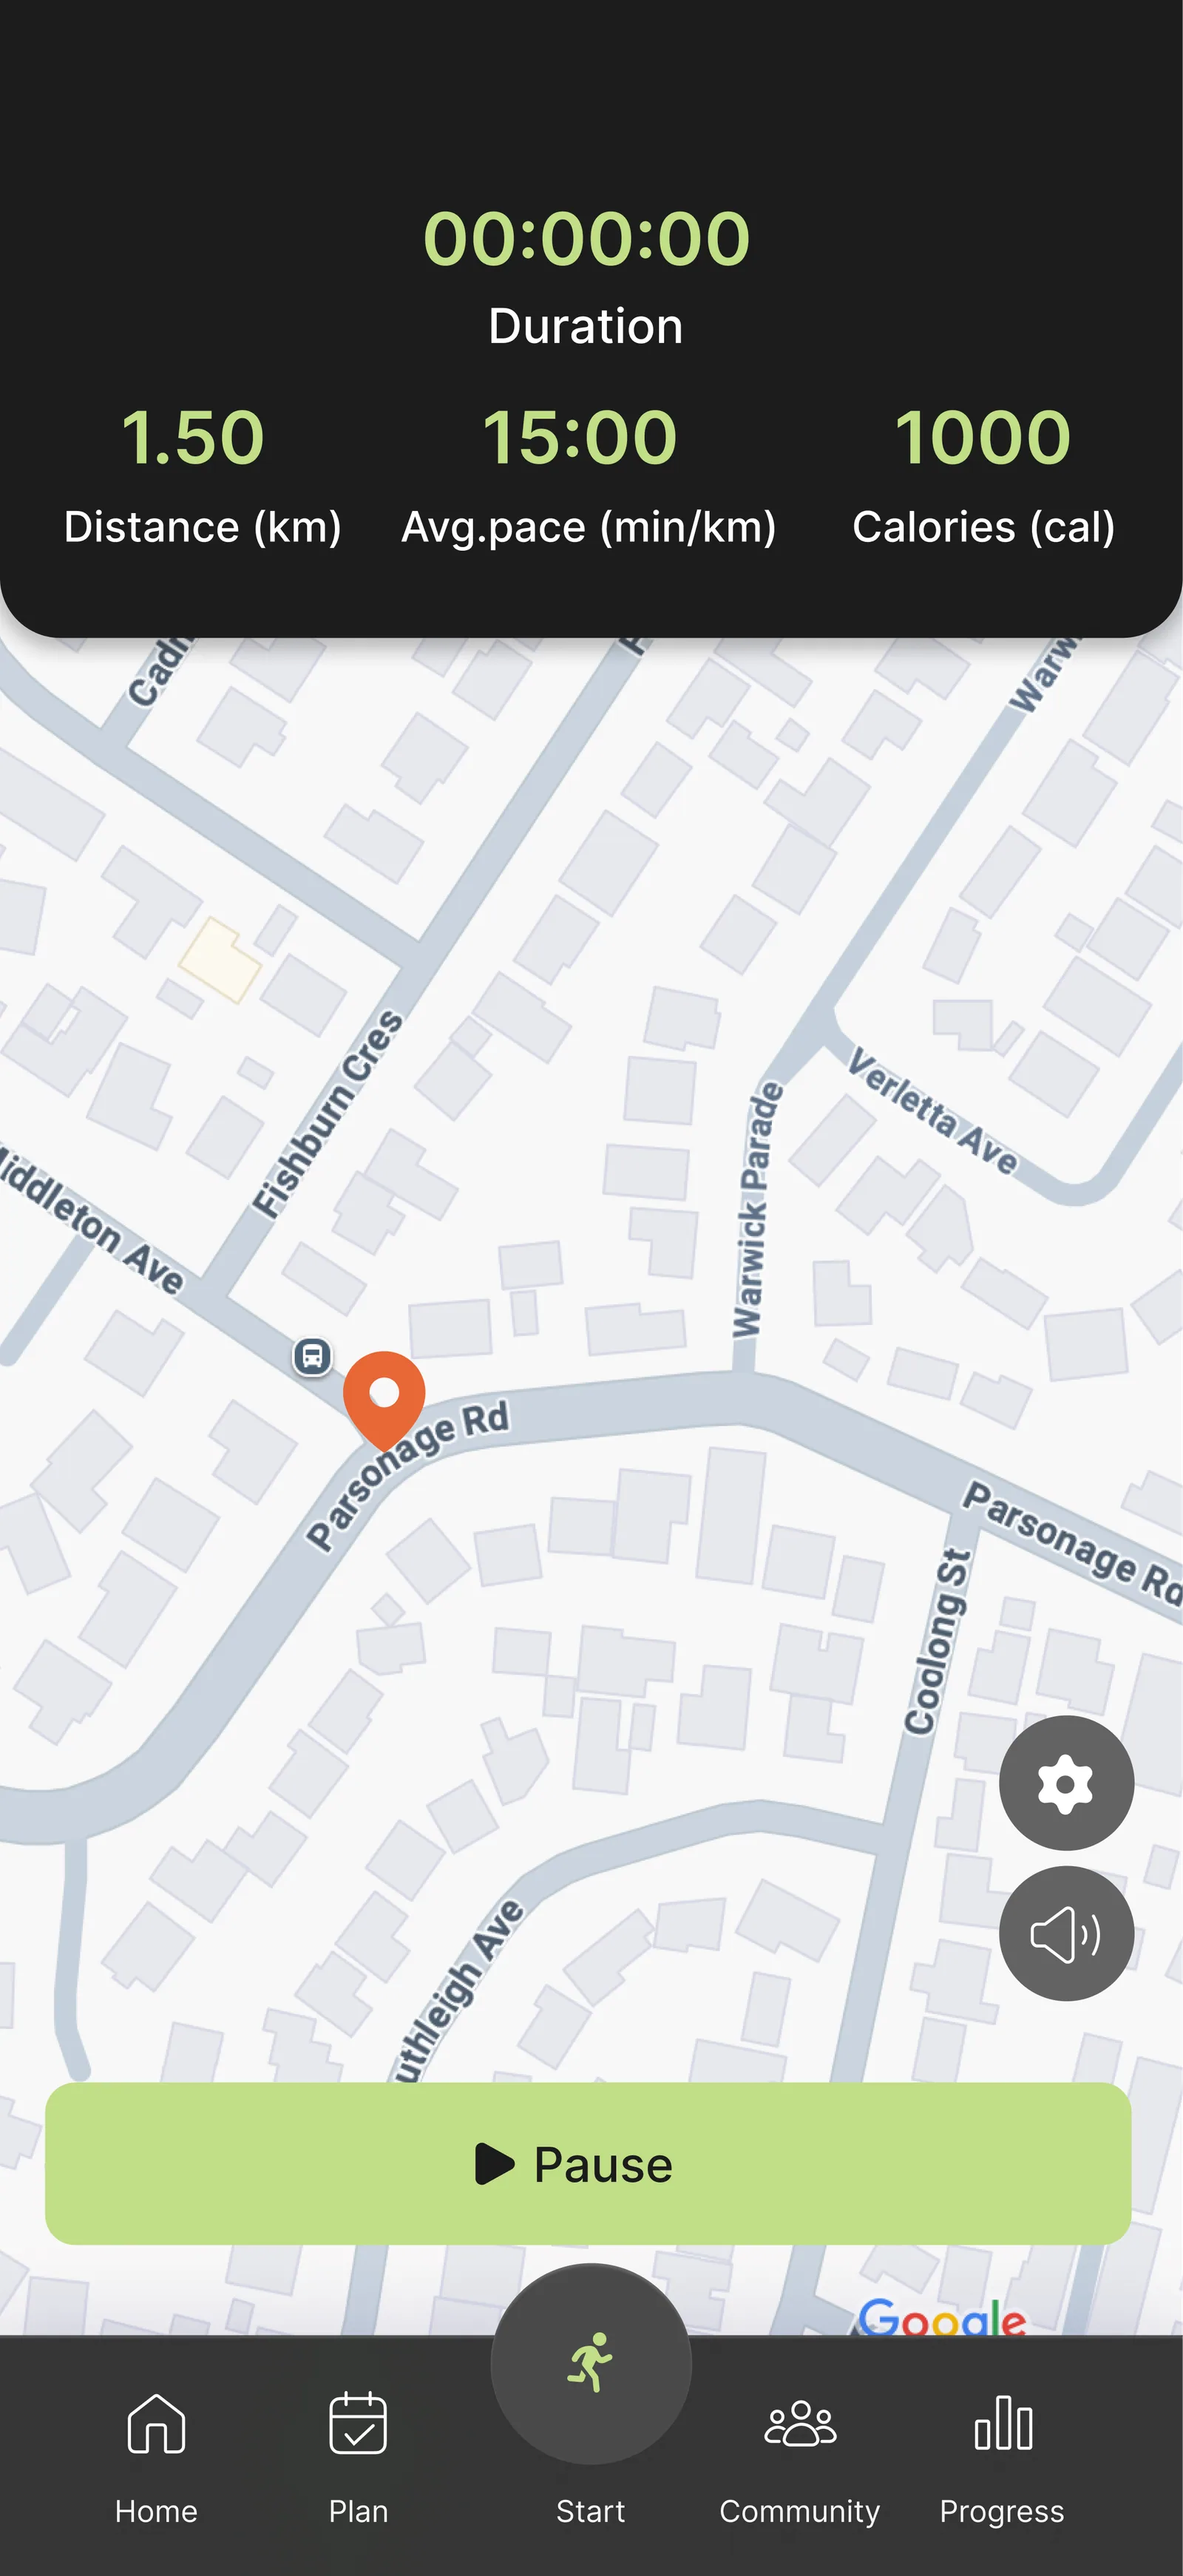
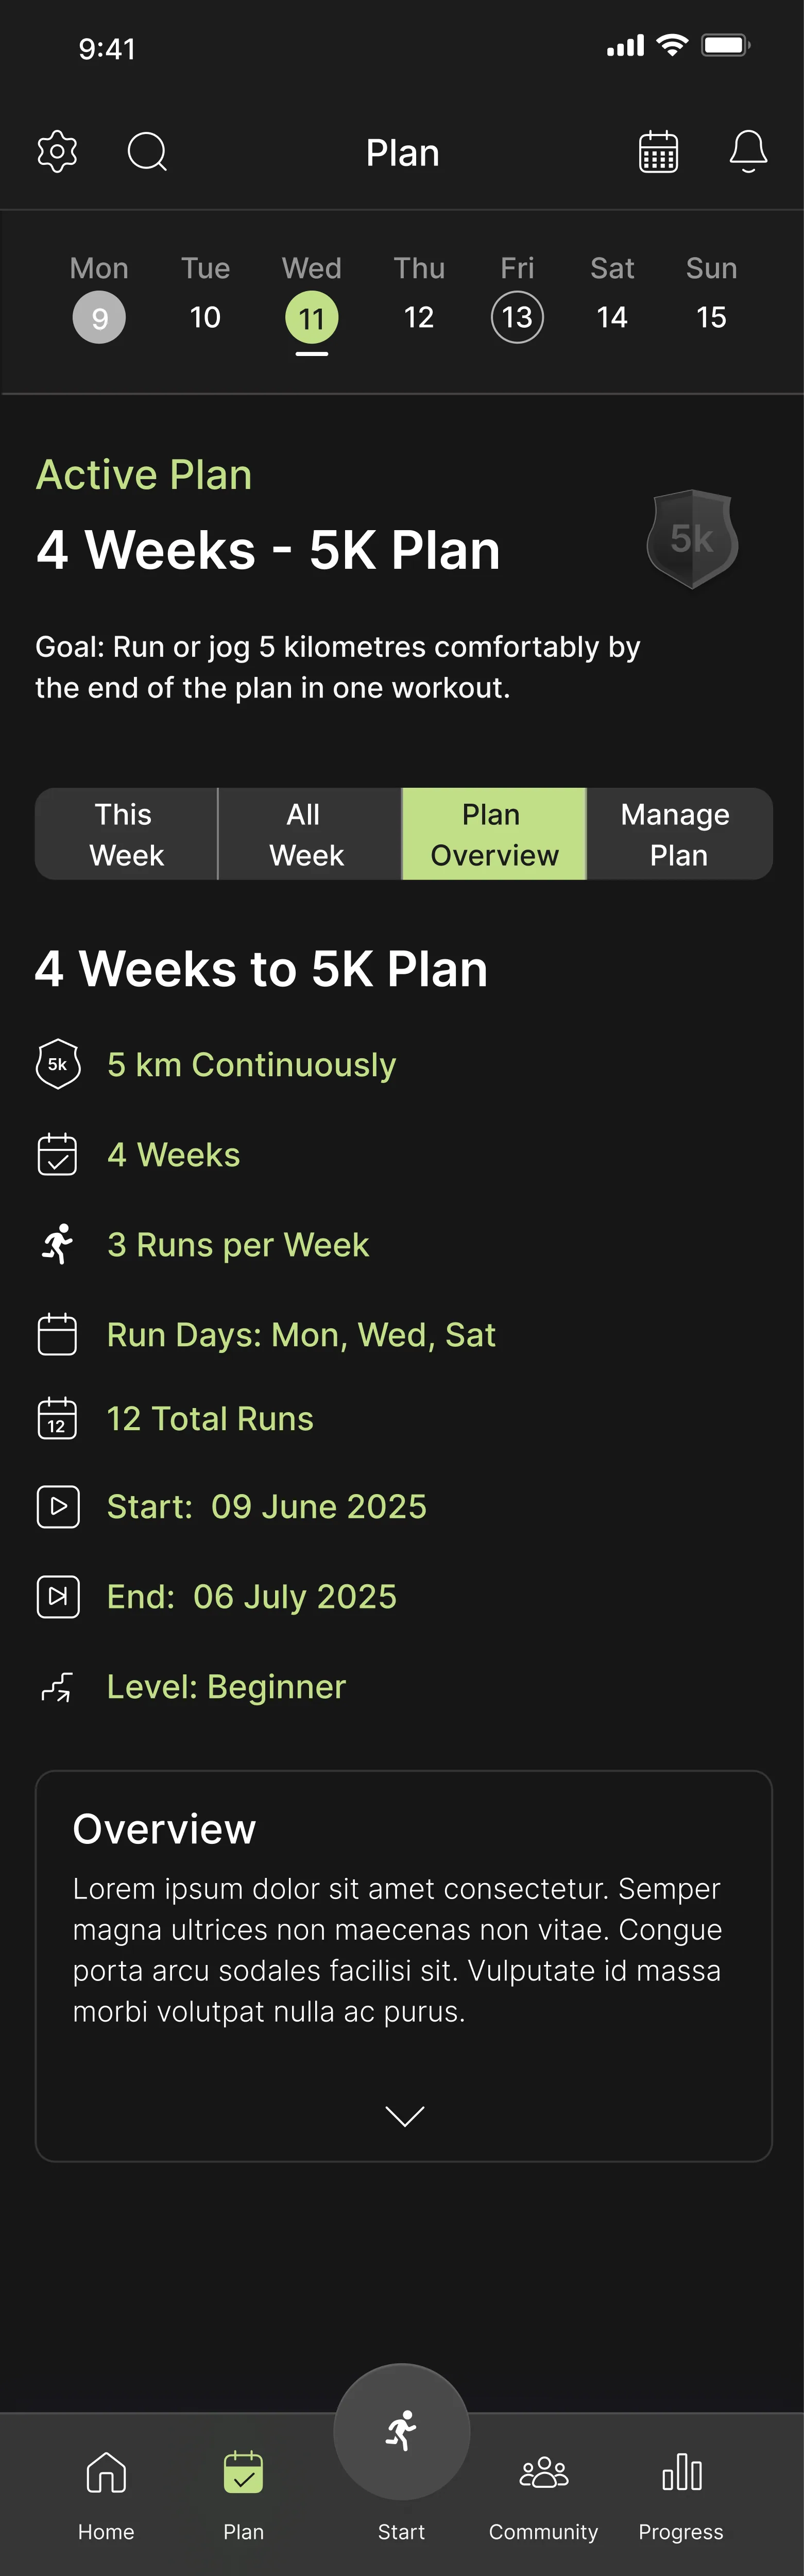
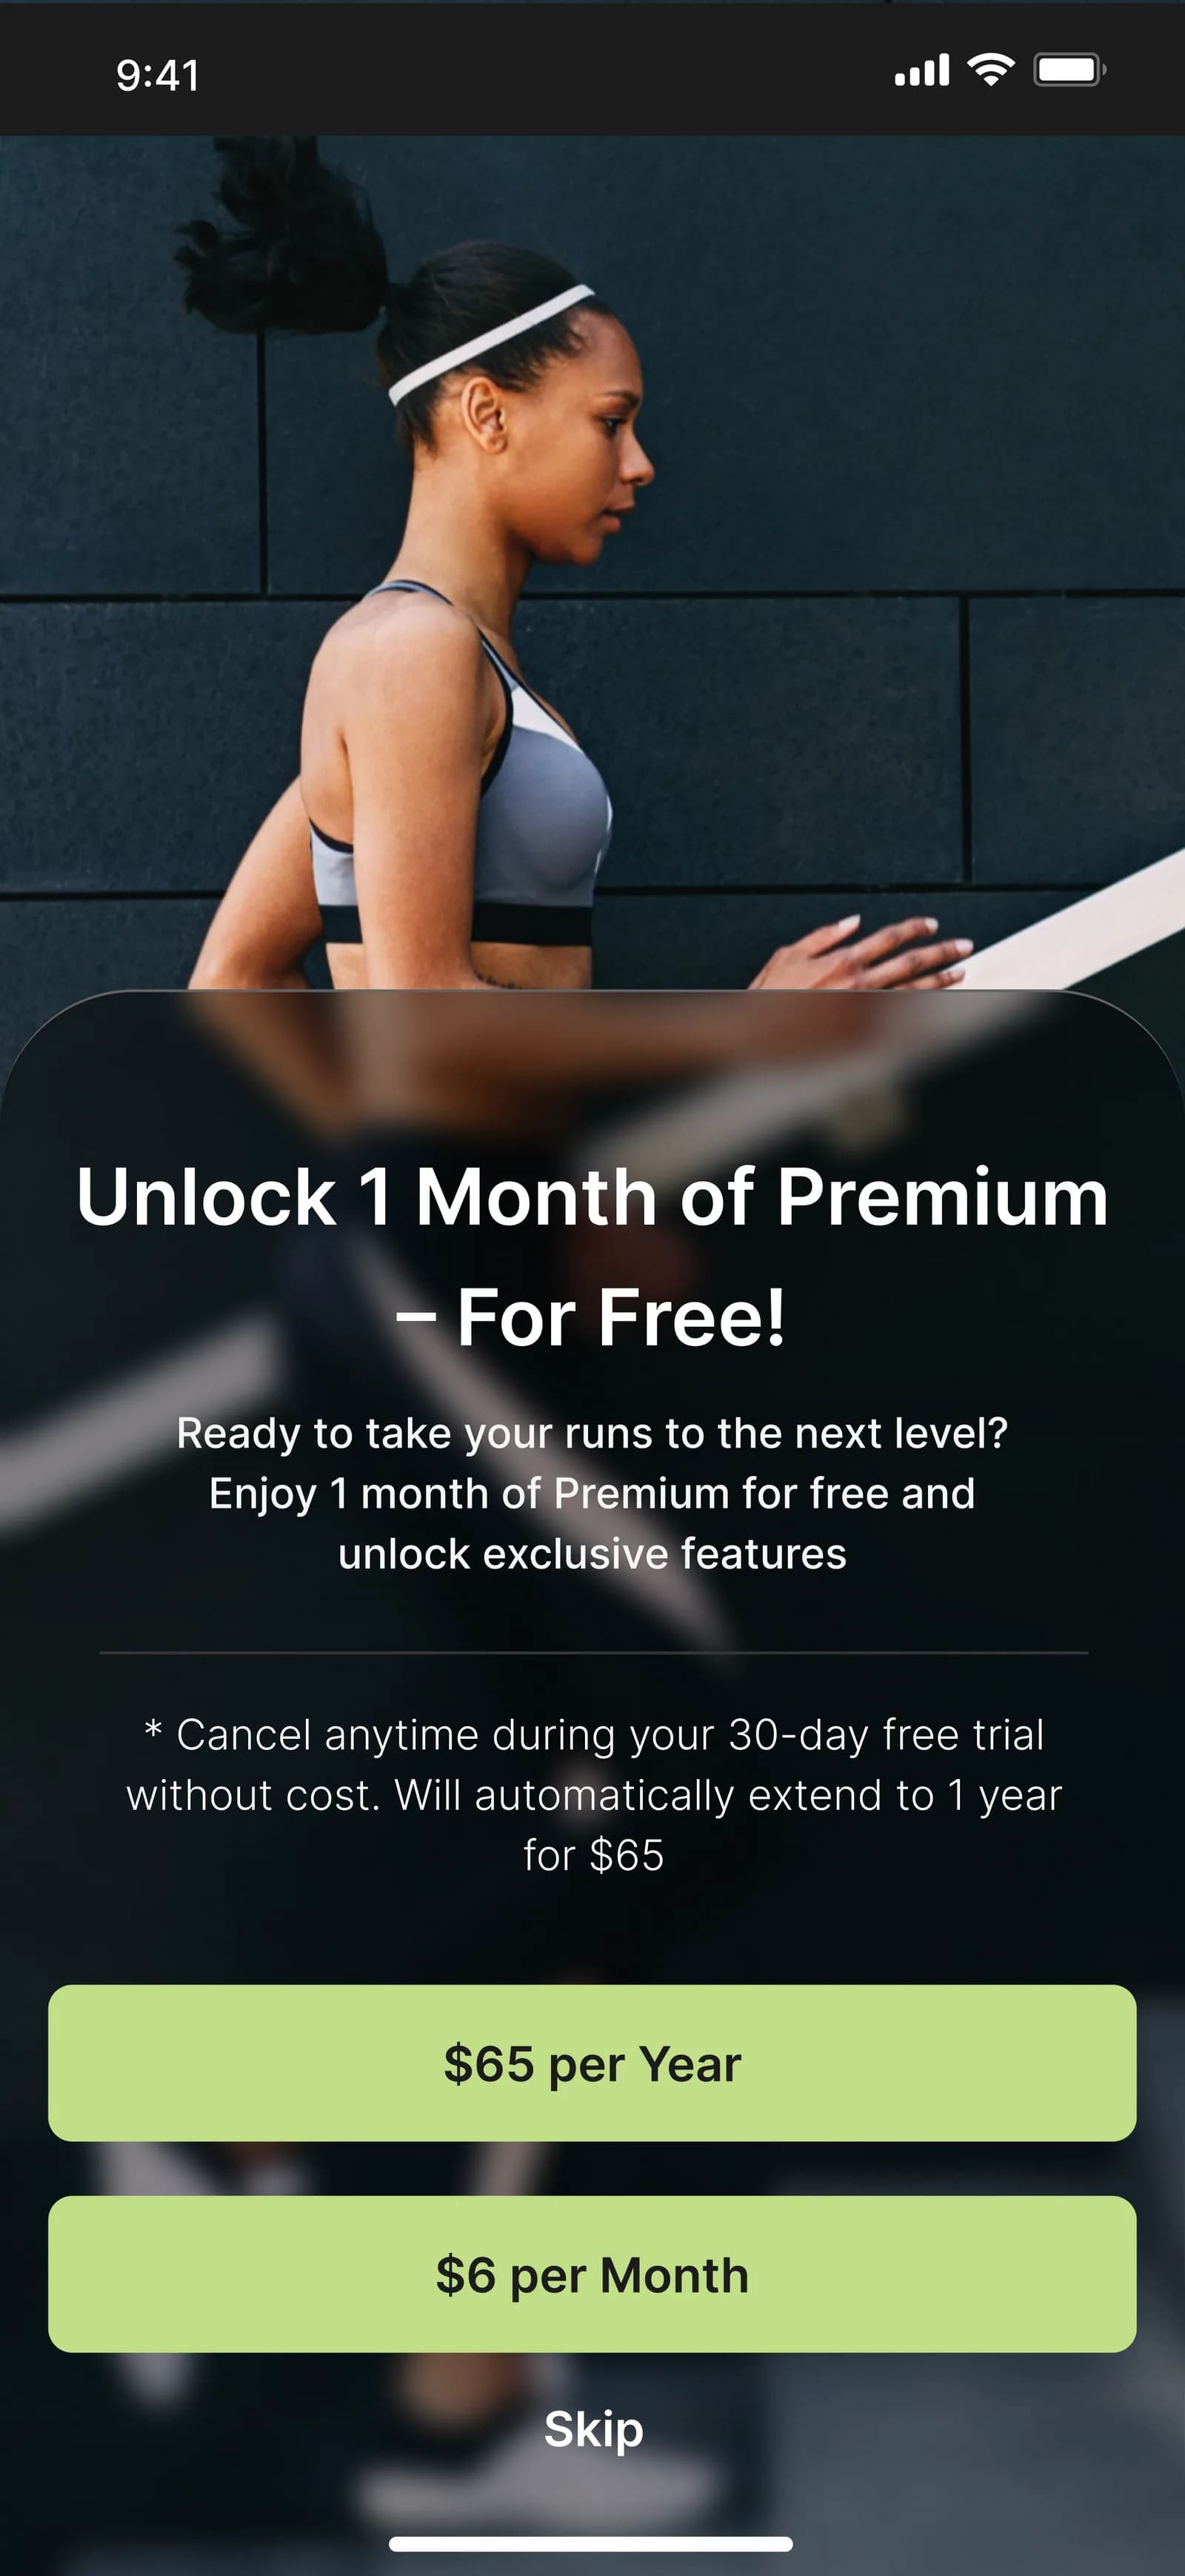
Won't have — and why the exclusions matter more than the list
- Global leaderboards
- The project's own research says they discourage beginners
- Nutrition tracking
- Dilutes the core promise
- In-app race registration
- Only 8% of respondents train for races
How we would know it worked
Proposed targets. None of these is a result — RunX did not ship, so none of them could be measured in use.
- Complete onboarding and generate a plan
- ≥ 70%
- First tracked run within seven days
- ≥ 50%
- Planned sessions completed per week
- ≥ 60%
- Return after 7+ inactive days and complete another run — the core hypothesis
- ≥ 40%
- Week-4 retention
- ≥ 30%
- System Usability Scale
- ≥ 75
Recovery rate is the metric the whole product is built to move. If the bridge week works, that number goes up and the others follow it.
Where the project ended, and what comes next
Six weeks took RunX from a blank page to a hi-fi prototype. It ended there deliberately — the scope was research through to interactive design, not launch. The next phase is already specified.
- Open card sort, 8–10 participants
- Whether the six top-level areas match how runners group these features — particularly Streak, Badges and Achievements
- Four-week diary study, 10 beginners
- Whether the bridge week actually changes real adherence, which no prototype test can answer
The card sort is written and ready to run. The diary study is the one that matters most and the one a six-week project cannot reach — adherence is a behaviour over time, and you cannot prototype your way to it.
What the project taught
Two data points that contradict each other are usually the most valuable finding in the set. Community scored 8% in the survey and appeared in every single interview. Resolving that tension — belonging, not ranking — shaped more of this product than any high-scoring feature did.
What would be done differently
Build testing into the middle of the timeline rather than leaving validation to the end. Recruit a wider age range: the sample under-represents runners over 45, a large share of the recreational market. Ask about willingness to pay with concrete price points instead of a yes or no question. And test the plan-generation logic against real training data with a coach, not only the interface with users.
Research this thorough, on your product
RunX is what the research half of NEXA Studio looks like when it runs to the end: interviews, a survey, a benchmark, personas, a journey map and an information architecture, before a single screen is drawn.